Abstract
Background: The fulfilment of the emergency response to the disaster area not only prioritises foods or medicines but also helps in mobilisation of equipment, facilities, and infrastructures in the form of logistics. The suitable warehouses will be able to provide every logistic needed and this will have a positive impact on the government as one of the relief institutions that is responsible for helping the refugees as quickly as possible.
Objectives: The objectives of the study are to determine the logistic needs from disaster area, analyse and evaluate all assets from the 35 warehouses, identify the key indicators to generate the parameter, and to generate several mathematical formulas to be used in the simulation case.
Method: Euclidean-based methodology is applied to calculate every fitness distance as a gap value of each parameter. All stock quantity from 35 warehouses will be the source of the data, with the logistic needs play role as the initial input for the calculation processes.
Results: The logistic needs and the distance resulted in this study became the key indicators to determine the criteria. The study also generates seven equations for the disaster’s case simulation.
Conclusion: To conclude, the outcomes resulted from the simulation indicate that from 35 warehouses alternatives, the fitness gap calculation completed at the 31st warehouse and the public hydrant became the fastest logistic, which completed all demand by two warehouses.
Contribution: The study will be useful for the decision makers as the recommendation and guideline to improve the acceleration of emergency response of the logistic mobilisation from selected and prioritised warehouses.
Keywords: emergency response; warehouse; disaster; logistic; relief; refugees; decision model; Euclidean.
Introduction
Natural hazards such as landslides, volcano eruptions, earthquakes, hurricanes, tsunami, and floods bring about tremendous effects on people and demolish the infrastructures. These situations have exacerbated the negative impacts by elevating the number of deaths and damaging facilities, which can lead to the social and economic instability thus inflicting a demand–supply imbalance (Zhou et al. 2018:567–576). When a destructive disaster strikes an area, the number of victims grows rapidly followed by the escalating number of disaster refugees. As the number of refugees increases, the demand of emergency supplies such as medical equipment, medicines, food, and water would immediately surge (He et al. 2017). Therefore, the response to the situation should be quicker than for a small-scale disaster.
The important thing that always happens in every response process is about the distribution of logistics. Logistics in the form of food, water, medicine, clothing and other essential necessities play a significant role of a refugee camp.
During the initial stages of emergency situations, the collaboration of governments, institutions, groups, and individuals becomes critical in assisting disaster refugees (Pradipta et al. 2017:95–102). This collaboration, commonly known as disaster relief operations (DROs), encompasses a range of general disaster operations aimed at alleviating adverse situations that hinder the satisfactory distribution of essential relief supplies to disaster refugees by allocating the temporary disaster response facilities (Cavdur, Kose-Kucuk & Sebatli 2016). In emergency situations, logistics planning involves rapidly dispatching commodities to distribution centres in affected areas, thus accelerating relief operations (Özdamar, Ekinci & Küçükyazici 2004:217–245).
The issues of logistic readiness of warehouse inventory and the shortage of human resources with expertise in logistics management pose a significant threat to the quick decision-making of the emergency disaster response teams. To facilitate effective decision-making for logistic mobilisation, the assessment of various influencing factors is required to enhance the efficiency of decision-making processes.
A warehouse assumes a fundamental role in disaster response, serving as an essential storage facility for relief supplies. The significance of warehousing lies in its direct contribution to easing the distress of affected individuals, by reducing the time taken to reach them. In addition, it fosters synergy and coordination among a wide array of governmental, non-governmental, national, and international organisations engaged in disaster management (Maharjan & Hanaoka 2017:1151–1163). While these worldwide catastrophes have notably heightened humanitarian assistance for the distribution of relief supplies, the importance of emergency logistics persists both during and after such calamities. Therefore, ensuring the establishment of a capable and streamlined emergency logistics management system becomes critical to address any unforeseen circumstances (Kundu, Sheu & Kuo 2022).
Logistics preparedness needs to be established at warehouses located in close proximity to ensure swift handling of distributions. In certain countries, the government maintains its own warehouses to store logistic assets, which are strategically positioned in each province. This set-up facilitates the rapid mobilisation of the logistics to the nearest disaster area. Selecting the right warehouse locations for disaster response is a critical decision that can impact the success of the relief effort. Preparedness enhances the capacity of relief institutions to efficiently mobilise relief supplies and deliver aid promptly. The oversight of logistic performance during a disaster is referred to as disaster logistics rescue operations. Emergency logistics is defined as the supportive role that guarantees the timely delivery of emergency resources and rescue services to impacted areas, thus facilitating rescue activities (Adiguzel 2019:212–224).
Governing various types of logistics across different warehouses is important for conducting swift calculations and immediate decision-making to accommodate all necessary requirements. Numerous studies have been conducted in the field of logistics and warehousing, with a particular focus on the selection of warehouse locations. These studies propose various frameworks, including one based on three categories: infrastructure, government and market (Singh, Chaudhary & Saxena 2018:323–356). In addition, researchers have proposed a framework for a strategic Decision Support System (DSS) that combines elements of the strategic management process and the Strategic Information Systems Planning (SISP) process (Kamariotou et al. 2017). Furthermore, researchers have explored the issue of selecting warehouse processes by employing different strategies, applying decision-making tree with probabilities to guide warehouse strategy selection (Kłodawski et al. 2017:451–457).
Based on previous studies mentioned in this article, it is evident that a common challenge in the logistic distribution process is ensuring a rapid response. Swift deliveries and increased speed of logistics mobilisation require support from nearby warehouses. Therefore, the implementation of a DSS is crucial for decision makers (DMs) to determine warehouses based on several factors. In this article, we will delve into the process of warehouse selection, identifying the key factors that must be taken into account while making decisions, and creating a decision model as a part of a DSS. This will involve generating multiple formulas to ascertain the necessity and how warehouses can satisfy all demands through logistic availability, as well as how the proximity of a warehouse influences the efficiency of the calculation.
The objective of the proposed decision in this study is to meet the requirements of disaster shelters. The formula presented in this research systematically guides the calculation process until it reaches a value of zero (0), signifying the fulfilment of demand.
The article is organised into the following sections: The literature review which conducts a literature review of relevant studies to support better understanding of the case. The research methods and design section which describes the methodology used in this research. The analysis and findings section provides the analysis and findings of the study by parameterising, designed calculation formulas, and the test case. The discussion section presents the discussion of the research and the conclusion section defines the conclusion of the study.
Literature review
The objective of the study was to identify the most suitable warehouse for supply distribution based on specific parameters, aiming to address the uncertain demands of the disaster situation. Related domains are discussed in this section.
Warehousing selection has emerged as a pivotal logistical challenge within the realm of logistic operations, requiring a systematic approach to evaluate and compare various alternatives. A comprehensive study was conducted, proposing a warehouse location model to determine the most suitable site for stock mobilisation in relief distribution utilising the Analytic Hierarchy Process (AHP) model, leveraging six criteria and assessing three alternative locations for a relief warehouse (Hakim & Kusumastuti 2018:1405–1414). In some cases, certain criteria often differ with each other and hold varying degrees of importance, making it challenging for decision-makers to reach an optimal choice.
To convey these challenges, various multicriteria decision making (MCDM) methods have been implemented in numerous studies to integrate multiple criteria into a streamlined decision-making framework. Such a study performed by researchers aimed to find solutions in warehouse selection problem, utilising MCDM processes with AHP and technique for others preference by similarity to ideal solution (TOPSIS) methods to identify the optimal warehouses for a garment industry with a few models, resulting in the successful calculation and selection of the best fit among three available options (Al Amin et al. 2019).
In the domain of sustainable warehousing, researchers carried out a study to determine the ideal warehouse for solar transformation by ranking 10 alternative warehouses through the application of TOPSIS and comparing the results with the payback period method, revealing the same top choice of the two methods, while the remaining options in the two lists differ as were expected (Boztepe & Çetin 2020:97–110). The selection of warehouse requires a decision-making tool that can take the form of a framework or even a machine. A study performed by researchers aimed to create a decision support framework to identify the most appropriate warehouse based on five criteria, which integrated fuzzy AHP method to rank the warehouses, fuzzy TOPSIS method to evaluate the criteria, and a sensitive analysis to overcome the issue of variation in judgement from different person (Roh, Shin & Seo 2018:297–307).
In the context of disaster response, emergency logistics refers to the logistical operations driven by critical situations, encompassing the emergency allocation, transportation, and distribution of necessities to meet exigent requirements in disaster area, aiming the time efficiency and decreasing the impacts of disasters (Xu, Fang & Jin 2018). The objectives and decision factors for emergency logistics should focus on saving lives, alleviating human suffering, and reducing property damage. The main objective involves gathering and dispensing of emergency resources to the disaster area even though several interrelated tasks arise because a variety of decision issues need to be simultaneously factored in (Jiang & Yuan 2019).
To reduce the loss of lives caused by disasters, timely aid should be provided shortly after a disaster occurs, given the consistently significant need for a wide range of relief supplies (Olanrewaju, Dong & Hu 2020), as the action of preparedness stage. One of the factors to be considered in the preparedness phase is the availability of logistics, which needs to align with the requirements of the disaster area.
Some challenges that need to be addressed in emergency logistics of relief supplies include demand estimation, which is difficult because of uncertain and fluctuating reports, as well as the lack of stock asset management in both using existing regional logistic infrastructure and prepositioning stock (Negi 2022). A study was conducted by researchers aimed at predicting the logistic needs based on age and gender categories, which serve as guidance for governments or organisations in managing logistic support (Handayani et al. 2019).
A warehouse, functioning as logistic storage facility, is crucial for evaluating decisions from various perspectives, including proximity to the disaster area, which can enhance and refine the performance of DROs. Significant research has been performed on decision modelling, location optimisation, and simulation based on distance measurement. Researchers conducted a study to optimise medical supply using the Fuzzy C-Means (FCM) method, considering factors such as helicopter travel time, transfer time, and vehicle delivery time, thereby providing methodological and operational support in responding to large-scale disasters (Ruan et al. 2016:1–19).
In the context of emergency supplies, vehicle route management becomes a pressing challenge, aiming to calculate distance as the function for selecting the shortest path between origin and destination to ensure efficient distribution performance (Safeer et al. 2014:2248–2258). A literature review and research on determining decision factors in logistics distribution has been conducted, involving the spatial layout of the cargo transportation and warehousing system (Onstein, Tavasszy & Van Damme 2019:243–260). On the other hand, researchers have presented a distance matrix approach for routing optimisation, demonstrating that the solution model results in the least amount of travel time and significantly outperforms other routing method (Shetty, Sah & Chung 2020). While implementing the concept of humanitarian logistics and disaster relief supply chain, a framework was developed for managing risks in the context of disaster relief supply chain and providing a decision-making tool (Raillani et al. 2020:181–193).
In this research, warehouses are regarded as essential facilities for storing and assisting the emergency response equipment and the infrastructure. The strategic selection of suitable warehouses situated near the disaster area can profoundly impact the speed and effectiveness of relief efforts. The chosen warehouses are assumed to possess the capacity to fulfil all demands related to the disaster. Several crucial factors are considered in logistic distribution decisions, including the quantity of logistic needs driven by total refugees and the proximity to the disaster area. The study aims to integrate warehouse selection decisions into a cohesive decision-making framework.
Research methods and designs
The study primarily focuses on addressing fundamental post-disaster infrastructure needs, specifically highlighting clean water and sanitation supplies, within the realm of humanitarian logistics. To develop our proposed research methodology for studying a disaster case, we have adopted the Decision Support Model (DSM) Wheel approach as the foundational methodology (Utama 2021), illustrated in Figure 1. The DSM Wheel stages provide a thorough understanding of the decision-making process. While constructing the model, various constraints are applied as limitations among entities.
According to Figure 1, Utama (2021) outlines the stages one by one. The initial stage encompasses the process of analysing the case. During the development of the decision-making concept, it is imperative to establish a clear definition of the research object’s issue. Achieving a high-level interpretation of the object is essential, requiring a thorough grasp of all pertinent aspects. Employing methodologies such as observing recent cases and conducting interviews with DMs throughout the supply handling procedure proves invaluable in analysing information and attaining a comprehensive understanding of the case, thereby identifying the underlying issues. The outcome of this stage is determining the most suitable warehouse selection. In the second stage of the decision analysing process, it is necessary to ascertain the decision value through the proposed alternatives. The decisions made in this research should accommodate considerations and measurements regarding whether all or some warehouses could fulfil the logistic needs of the disaster area, or if none of them could. Following several interviews with the DMs, observations, and a review of previous research, the conclusions drawn for the alternative warehouse selections are categorised as either ‘fit’ or ‘not fit’. The third stage in this methodology involves parameterisation. This entails analysing various potential indicators, understanding the role of each indicator in relation to the case, identifying their origins, and exploring the interrelationships between criteria. The determination of the final criteria suitable for this research is informed by interviews, observations with the DMs, and a review of relevant previous works for references. A common approach of this phase involves exploiting deep learning or influenced diagram. The fourth stage includes data collecting or generating, which can pose significant challenges within the realm of DSM. Some researchers may lack available data and may need to generate it directly in the field. Once all parameters are established, data from various sources and in a different format must be generated. These data then need to undergo processes such as collection, cleaning, merging, and normalisation. During this stage, we gathered the data and information through interview sessions with the DMs. Dataset was generated from the 35 warehouses, including proximity, the stock availability, and total refugees. The collected data should encompass all criteria and be relevant to the model’s simulation. The fifth stage entails the process of constructing the DSM, which involves creating the model simulation. It is crucial to establish a clear scheme of input, process, and output within the model. This phase includes the employment of in-depth analysis and mathematical logic methods for implementation. The sixth stage involves the process of decision proposition. The DSM explicitly puts forward one or multiple decision alternatives, selecting the most optimal among them. The outcomes tested and analysed during the second stage are identified and suggested by the model. However, the ultimate determination rests upon the DMs’ judgement. The seventh stage entails model verification and validation. This marks the ultimate phase of research methodology. Model verification and validation are two distinct concepts aimed at assessing the dependability of a model’s outcomes and the quality of its solutions (Zamanifar & Hartmann 2020). Verification involves evaluating the formula, number of the parameters, data types, logical functions, and calculations, based on theoretical references. On the other hand, validation encompasses assessing whether all model-generated values remain within specified limits. Additionally, a Euclidean method was applied to the calculation of gap analysis by calculating the distance between original value and destination value. The formula is described in Equation (7).
Ethical considerations
Ethical clearance to conduct this study was obtained from the Binus University (No. 031/Dir.BGP/III/2023).
Analysis and findings
A comprehensive set of criteria, parameters, and mathematical formula as the contextual framework for the analysis was developed. In this specific case, we have identified the essential necessities through extensive dialogues and interviews with DMs representing the observed institution. These discussions have encompassed all pertinent assets housed within each warehouse (W), which play a significant role in addressing the challenges posed by disaster situations.
To deal with these challenges identified within the institution, we have defined criteria and parameters, which are outlined in Table 1. Additionally, various attributes have been generated where the codes: MTA represents water tank wheel, HU refers to public hydrant, ET refers to emergency toilet, VT signifies faeces vacuum vehicle, and PO stands for the operator.
Following the guidelines of the National Disaster Mitigation Agency (Badan Nasional Penanggulangan Bencana [BNPB]) No. 7 (2008) regarding the procedure for providing necessities during emergency response to a disaster occurrence and aligning with the standardisation of the researched institution we have derived certain standard measurements as the basis for evaluating the disaster condition, as outlined in Table 2.
| TABLE 2: Standard values of the research. |
The complete mathematical model computation of this research is depicted in the algorithm diagram, illustrating the sequence of all procedures. The definition of algorithm is approached from an intuitive and practical perspective, informed by philosophical methodology rather than formal computation (Hill 2016:35–59).
An algorithm is a systematic step-by-step procedure used to solve mathematical problems in a specific order. To comprehend the entire calculation processes employed in this research, the algorithm diagram is presented in Figure 2, accompanied by the detailed procedure given below. In addition, Table 1 functions as a guide for the associated codes, offering an overview of the subsequent steps:
- Step 1: Read disaster area.
This step involves receiving input data for the location of the disaster.
- Step 2: Input total number of refugees (JW).
After a disaster occurs, the current data from the government or BNPB about the approximate number of refugees is collected.
- Step 3: Calculate total water demand.
The calculation of the total demand for clean water (CL) based on the total number of refugees, using standard values from Table 2 for water needs per day and Equation 1.
- Step 4: Calculate MTA demand.
The calculation of demand for MTA based on the water tank capacity of 4000 litres per tank from Table 2 and Equation 2.
- Step 5: Calculate HU demand.
The calculation of demand for HU based on the total number of MTA. Each MTA requires two units of HU, as indicated by the capacity of each HU (2000 litres) in Table 2 and Equation 3.
- Step 6: Calculate ET demand.
The calculation of demand for ET based on the standard capacity of 20 persons per toilet from Table 2 and Equation 4.
- Step 7: Calculate VT demand.
The calculation of demand for VT based on the capacity of each VT to accommodate a maximum of 100 litres of faeces and the vacuum tank capacity of 2000 litres to service one toilet, using Table 2 and Equation 5.
- Step 8: Calculate PO demand.
The calculation of demand for operators required to handle the infrastructure. Based on interviews conducted in this research, the approximation of six people to handle one logistic is used, as shown in Table 2 and Equation 6.
- Step 9: Set Total demand.
Resulting from calculations in step 3 to 8.
- Step 10: Calculate warehouse proximity.
The calculation process of proximity of all warehouses in the database using Equation 7.
- Step 11: Calculate fitness distance.
The calculation of fitness distance using Equation 8.
- Step 12: Condition formula.
Read the condition formula. If the stock in a warehouse is greater than the demand value, the gap value is set to zero.
- Step 13: Decision process.
If the condition in step 12 is met, the calculation process is completed. Otherwise, proceed to the next calculation by adding a warehouse.
- Step 14: Warehouse mobilisation.
The phase of mobilising the warehouses for logistic distribution when all demands are fulfilled by selected warehouses. The calculation process is conducted at this stage.
Drawing from the standardised capacity values outlined in Table 2, we construct a series of mathematical models to quantitatively assess the demand for various logistic items. By formulating specific equation codes and translating parameters into mathematical expressions, we establish a coherent framework. Understanding the comprehensive interplay of these codes is crucial for comprehending the holistic conceptual model.
This study employs distinct codes to represent variables, which are then translated into summation notations: ΣJW signifies the sum of refugees in disaster area, ΣCL represents the total demand for clean water (CL) in the simulation, ΣMTA (or L1) denotes the total demand for water tank wheels, ΣHU (or L2) embodies the total demand for public hydrant, ΣET (or L3) encapsulates the total demand for ETs, ΣVT (or L4) encompasses the total demand for vacuum tank vehicles, and ΣPO (or L5) corresponds to the total demand for operators. This extensive approach enables systematic determination of demand for crucial items within the simulated disaster scenario.
The numerical value of total refugees in a disaster area serves as the primary input for the ensuing computational processes, specifically in determining the demand for clean water within the disaster shelter. Subsequently, the value is incorporated into Equation 1 to calculate the overall clean water requirements of MTA, HU, ET, VT, and PO, using Equation 2 to Equation 6.
To verify and validate the formulas, we conducted a simulation to address the earthquake disaster scenario that took place on 25 February 2022, in Pasaman district, West Sumatera, Indonesia. According to the annual report of BNPB, the data revealed that approximately 16 000 individuals were impacted by the disaster. This fact marks the initiation point of our calculation process and yields the subsequent results outlined within Table 3.
| TABLE 3: Demand results for Pasaman district. |
To prioritise the selection of the nearest warehouse for logistic allocation, we employed the Euclidean distance methodology to determine the proximity value for each warehouse location. During this computation, proximity values for all warehouses are sequentially sorted from lowest to highest using Equation 7, where (x1, y1) represents the coordinate of one warehouse, (x2, y2)is the coordinate of another warehouse, and d signifies the proximity between (x1, y1) and The stock data of logistics items across 35 warehouses provides the basis for the calculation, facilitating an analysis of allocation. The sorted distances within the W code variables are applied for sequential computations, leading to the establishment of fitness gap values for each demand. The process is executed through the formulation of Equation 8 within the mathematical model, using mixed integers. Where, variable G represents the Gap value; from S every Wn variable D represents Demand, variable S represents Stock, variable n as the number of sorted warehouses (while n = 1, 2,…,35), variable i as the number of logistic item (while i = 1 to 5), Wn represents the quantity of demand logistic n, and Li represents the item of i
with condition IF 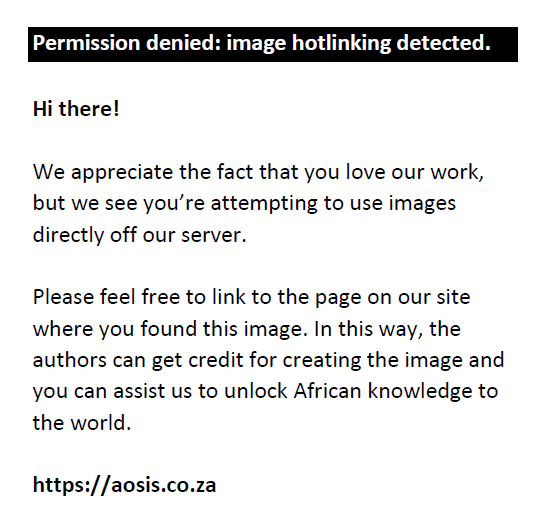 and and 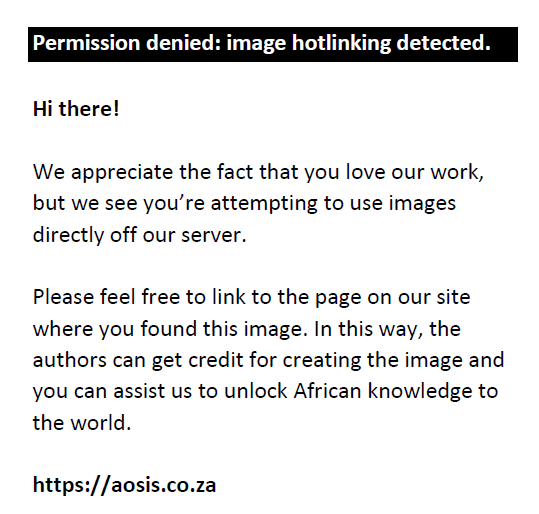
Several assumptions for this computation are:
- The disaster area chosen serves as the case study.
- The total number of refugees is a known quantity.
- The mileages of 35 warehouse locations have been determined.
- The proximity of sorted warehouse locations is utilised in sequential calculations.
- Priority is assigned to the nearest warehouse locations during computation.
- A value of zero (‘0’) resulting from the calculation signifies complete fulfilment of all demands.
Once all the demands for the Pasaman case were determined, as listed in Table 3, the next step is to ascertain the number of warehouses required to support the disaster-stricken area. To achieve this, we begin by calculating the distances from the warehouse to disaster area and prioritise the calculations based on proximity, starting from the nearest distance and extending to the farthest. The results of the calculations obtained using Equation 7 for all warehouse distances are organised and presented in Table 4.
The ensuing step involves the calculation of the fitness gap starting from the first warehouse. The values presented in Table 5 are obtained by performing calculation for demands listed in Table 3. These calculated values function as the initial inputs to initiate the computation process, with the sequence of operations determined based on the order of the sorted warehouses in Table 4, ranging from the lowest proximity value of W1 (208 km) to the farthest proximity of W35 (5.975 km).
| TABLE 5: The initiation fitness gap with Warehouse 1. |
The initial allocation process, supported by the first warehouse (W1), is detailed in Table 5. However, this single warehouse allocation fails to meet any demands. Consequently, the allocation process advances to the following nearer warehouse. As can be seen in following allocation process depicted in Table 6, the fitness gap value of L2 has reached zero. It means that L2 has completed all demand of the disaster shelter. Meanwhile, L1, L3, L4 and L5 have not achieved their respective demand targets, prompting the calculation’s continuation to the subsequent warehouse. Notably, L2 emerges as the first logistic item to fully satisfy disaster area demands, aided by two warehouse allocations. Yet, four logistic items still lack complete allocation fulfilment, compelling further allocation efforts to nearer warehouses. Harnessing data from Table 7, L1 becomes the second logistic item to attain full demand completion, registering a zero value in the fitness gap. Fulfilling the logistic demands of L1 requires allocating resources from nine warehouses (W1 to W9).
| TABLE 6: The Public hydrant accomplishment. |
| TABLE 7: The Water tank wheel accomplishment. |
As only two logistic items have successfully completed all demands, the subsequent task includes calculating the logistic requirements from items L3 to L5. The calculation process, as shown in Table 8, reveals that L5 becomes the third logistic item to fulfil all demands and attain a fitness gap value of zero, with support from 12 warehouses (W1 to W12). Two more logistic items require calculation for demand allocation. As reported in Table 9, L4 becomes the fourth logistic item to complete its demand and achieve a fitness gap value of zero, with the assistance of 21 warehouses (W1 to W21). Finally, as shown in Table 10, L3 represents the last logistic item to fulfil the allocation and gain a fitness gap value of zero with the assistance of 31 warehouses (W1 to W31). This outcome also signifies the completion of the entire requirements for L1 to L5 in the disaster, and indicates the conclusion of the calculation processes.
| TABLE 9: The Faeces vacuum vehicle accomplishment. |
| TABLE 10: The Emergency toilet accomplishment. |
Discussion
The mathematical model generated in this study is capable of accurately computing the demand requirements for disaster occurrence in Indonesia, aligning comprehensively with the guidelines set forth by BNPB. Simultaneously, the standardisation adopted serves as a guiding framework, ensuring that the process remains well-suited to the institution under investigation. The chosen logistics types harmonise seamlessly with the supportive functions of the researched institute, catering to the essential needs of clean water and sanitation. Through interviews with the DMs, it was revealed that each warehouse should ideally encompass five distinct categories of logistics: water tank wheel, public hydrant, ET, faeces vacuum tank, and skilled operator. It is important to notice that these categories set the scope and constraints of the research.
The 35 warehouses employed in this study encompass a variety of logistic assets and exhibit variations in terms of stock availability. These warehouses are under the ownership and management of the researched institute, serving as pivotal basecamps for disaster emergency response operations. In practice, the computation spans multiple phases and requires the mobilisation of nearly all warehouses within the network. For the purpose of warehouse ranking, a Euclidean approach was applied as a fundamental method for proximity computation. The selected disaster scenario originates from the Pasaman district incident, involving around 16 000 refugees, thereby qualifying as a large-scale disaster. Thus, the calculation necessitates an extended timeframe and nearly comprehensive warehouse mobilisation.
Future research could delve deeper into refining the mathematical model presented in this study, aligning it with alternatives guidelines or standards to assess its adaptability across various disaster scenarios. Further exploration might emphasise the integration of real-time data streams and dynamic variables, enriching the existing model’s responsiveness and accuracy. In addition, extending the current methodology to embrace multiobjective optimisation of advanced technologies to integrate proximity-based warehouse selection with broader considerations.
Conclusion
Logistic mobilisation stands as a paramount factor in swiftly determining emergency response, bearing significant consequences for overall warehouse operations. This study offers a resolution to the optimisation challenge of warehouse selection by generating eight new mathematical formulas and employing the fitness distance calculation through Euclidean approach, aligned with the standardisation set by BNPB and the researched institution. The primary aim of this study is to introduce a decision formula and ascertain the total demand of a disaster’s refugees. In summary, applying a simulation based on a real earthquake disaster scenario that occurred on 25 February 2022, in the Pasaman district of West Sumatera Province, Indonesia, and drawing insights from BNPB’s annual reports, it can be deduced that a disaster involving 16 000 refugees requires 240 000 litres of water supplies daily to meet their fundamental needs. This requirement calls for the implementation of 60 MTA, 120 HU, 800 ET, and 40 VT for waste extraction from each toilet. To effectively manage these infrastructures, a workforce of 170 individuals is essential.
Based on the fitness distance calculation conducted in this research, the outcomes reveal distinct patterns in the allocation of logistic resources. Notably, fulfilling the entire demand of HU necessitates the mobilisation of just two nearby warehouses. A particularly noteworthy finding is that meeting the demand for ET calls for the mobilisation of 31 warehouses. The distribution of resources for MTA and OP falls between these extremes, with 9 and 12 warehouses, respectively, being enlisted for their fulfilment.
Acknowledgements
The authors would like to acknowledge the following: Mr. Fajar Santoso Hutahaean as the supervisor of the research institution, Mr. Wahyu Restriono as the supervisor of the warehouse operations who shared the logistics data, Mr. Syekh Abdul Qadir and Mr. Tato as the disaster expertise who shared the knowledge of the actual national disaster operations, and Mr. Erie Hariansyah as the logistic expertise from the research institution who shared all the informations of the actual operations.
Competing interests
The authors declare that they have no financial or personal relationship(s) that may have inappropriately influenced them in writing this article.
Authors’ contributions
A.K.F. was the project leader and responsible for the project design, investigation, original manuscript, experiment and calculations. D.N.U. was the supervisor and responsible for the conceptual methods, formal analysis, validation, and co-wrote and reviewed the manuscript.
Funding information
This research received no specific grant from any funding agency in the public, commercial or not-for-profit sectors.
Data availability
Raw data were generated at the emergency response agency of the Ministry of Public Work and Human Settlements. Derived data supporting the findings of this research are available from the corresponding author, A.K.F., on request.
Disclaimer
The views and opinions expressed in this article are those of the authors and do not necessarily reflect the official policy or position of any affiliated agency of the authors.
References
Adiguzel, S., 2019, ‘Logistics management in disaster’, Pressacademia 6(4), 212–224. https://doi.org/10.17261/Pressacademia.2019.1173
Al Amin, M., Das, A., Roy, S. & Imran Shikdar, M., 2019, ‘Warehouse selection problem solution by using proper MCDM process’, International Journal of Science and Qualitative Analysis 5(2), 43. https://doi.org/10.11648/j.ijsqa.20190502.13
Boztepe, R. & Çetin, O., 2020, ‘Sustainable warehousing: Selecting the best warehouse for solar transformation’, Alphanumeric Journal 8(1), 97–110. https://doi.org/10.17093/alphanumeric.590216
Cavdur, F., Kose-Kucuk, M. & Sebatli, A., 2016, ‘Allocation of temporary disaster response facilities under demand uncertainty: An earthquake case study’, International Journal of Disaster Risk Reduction 19, 159–166. https://doi.org/10.1016/j.ijdrr.2016.08.009
Hakim, R.T. & Kusumastuti, R.D., 2018, ‘A model to determine relief warehouse location in East Jakarta using the analytic hierarchy process’, International Journal of Technology 9(7), 1405–1414. https://doi.org/10.14716/ijtech.v9i7.1596
Handayani, N.U., Rinawati, D.I., Sari, D.P. & Rifa’I, P.M., 2019, ‘The prediction of logistic needs of emergency response for victims of Merapi Volcano Eruption in Regency Sleman, Yogyakarta’, IOP Conference Series: Materials Science and Engineering, vol. 598, Institute of Physics Publishing, Jeju Island.
He, J., Feng, C., Hu, D. & Liang, L., 2017, ‘A decision model for emergency warehouse location based on a novel stochastic MCDA method: Evidence from China’, Mathematical Problems in Engineering 2017(1), 1–10. https://doi.org/10.1155/2017/7804781
Hill, R.K., 2016, ‘What an algorithm is’, Philosophy & Technology 29(1), 35–59. https://doi.org/10.1007/s13347-014-0184-5
Jiang, Y. & Yuan, Y., 2019, ‘Emergency logistics in a large-scale disaster context: Achievements and challenges’, International Journal of Environmental Research and Public Health 16(5), 779. https://doi.org/10.3390/ijerph16050779
Kamariotou, M., Kitsios, F., Madas, M., Manthou, V. & Vlachopoulou, M., 2017, ‘Strategic decision support systems for logistics in the Agrifood Industry’, in Proceeding: 8th International Conference on Information and Communication Technologies in Agriculture, Food, and Environment, Chania, September 21–24, pp. 781–794.
Kłodawski, M., Jacyna, M., Lewczuk, K. & Wasiak, M., 2017, ‘The issues of selection warehouse process strategies’, Procedia Engineering 187, 451–457. https://doi.org/10.1016/j.proeng.2017.04.399
Kundu, T., Sheu, J.-B. & Kuo, H.-T., 2022, ‘Emergency logistics management – Review and propositions for future research’, Transportation Research Part E: Logistics and Transportation Review 164(C), 102789. https://doi.org/10.1016/j.tre.2022.102789
Maharjan, R. & Hanaoka, S., 2017, ‘Warehouse location determination for humanitarian relief distribution in Nepal’, Transportation Research Procedia 25, 1151–1163. https://doi.org/10.1016/j.trpro.2017.05.128
Negi, S., 2022, ‘Humanitarian logistics challenges in disaster relief operations: A humanitarian organisations’ perspective’, Journal of Transport and Supply Chain Management 16, a691. https://doi.org/10.4102/jtscm.v16i0.691
Olanrewaju, O.G., Dong, Z.S. & Hu, S., 2020, ‘Supplier selection decision making in disaster response’, Computers and Industrial Engineering 143(6), 106412. https://doi.org/10.1016/j.cie.2020.106412
Onstein, A.T.C., Tavasszy, L.A. & Van Damme, D.A., 2019, ‘Factors determining distribution structure decisions in logistics: A literature review and research agenda’, Transport Reviews 39(2), 243–260. https://doi.org/10.1080/01441647.2018.1459929
Özdamar, L., Ekinci, E. & Küçükyazici, B., 2004, ‘Emergency logistics planning in natural disasters’, Annals of Operations Research 129(1–4), 217–245. https://doi.org/10.1023/B:ANOR.0000030690.27939.39
Pradipta, I.M.D., Dinda, M., Paramita, P. & Janardana, I.G.N., 2017, ‘System decision of natural disaster logistics (case study of Mount Agung Eruption)’, International Journal of Engineering and Emerging Technology 2(2), 95–102.
Raillani, H., Hammadi, L., Altimari Samed, M.M., El Ballouti, A. & Barbu, V.S., 2020, ‘Humanitarian logistics in the disaster relief supply chain: State of the art’, WIT Transactions on Engineering Sciences 129, 181–193. https://doi.org/10.2495/RISK200161
Roh, S.Y., Shin, Y.R. & Seo, Y.J., 2018, ‘The pre-positioned warehouse location selection for international humanitarian relief logistics’, Asian Journal of Shipping and Logistics 34(4), 297–307. https://doi.org/10.1016/j.ajsl.2018.12.003
Ruan, J., Wang, X., Chan, F. & Shi, Y., 2016, ‘Optimizing the intermodal transportation of emergency medical supplies using balanced fuzzy clustering’, International Journal of Production Research 54, 1–19. https://doi.org/10.1080/00207543.2016.1174344
Safeer, M., Anbuudayasankar, S.P., Balkumar, K. & Ganesh, K., 2014, ‘Analyzing transportation and distribution in emergency humanitarian logistics’, Procedia Engineering 97, 2248–2258. https://doi.org/10.1016/j.proeng.2014.12.469
Shetty, N., Sah, B. & Chung, S.H., 2020, ‘Route optimization for warehouse order picking operations via vehicle routing and simulation’, SN Applied Sciences 2(2), 311. https://doi.org/10.1007/s42452-020-2076-x
Singh, R.K., Chaudhary, N. & Saxena, N., 2018, ‘Selection of warehouse location for a global supply chain: A case study’, IIMB Management Review 30(4), 343–356. https://doi.org/10.1016/j.iimb.2018.08.009
Utama, D., 2021, Logika Fuzzy untuk Model Penunjang Keputusan, Dilengkapi dengan Penerapan Contoh Kasus, Garudhawaca, Yogyakarta.
Xu, H., Fang, D. & Jin, Y., 2018, ‘Emergency logistics theory, model and method: A review and further research directions’, Proceedings of the 2018 3rd International conference on Communications, Information management and network security (CIMNS 2018), pp. 188–192, Dordrecht, Atlantic Press.
Zamanifar, M. & Hartmann, T., 2020, ‘Optimization-based decision-making models for disaster recovery and reconstruction planning of transportation networks’, Natural Hazards 104(1), 1–25. https://doi.org/10.1007/s11069-020-04192-5
Zhou, L., Wu, X., Xu, Z. & Fujita, H., 2018, ‘Emergency decision making for natural disasters: An overview’, International Journal of Disaster Risk Reduction 27, 567–576. https://doi.org/10.1016/j.ijdrr.2017.09.037
|